Links
Overview
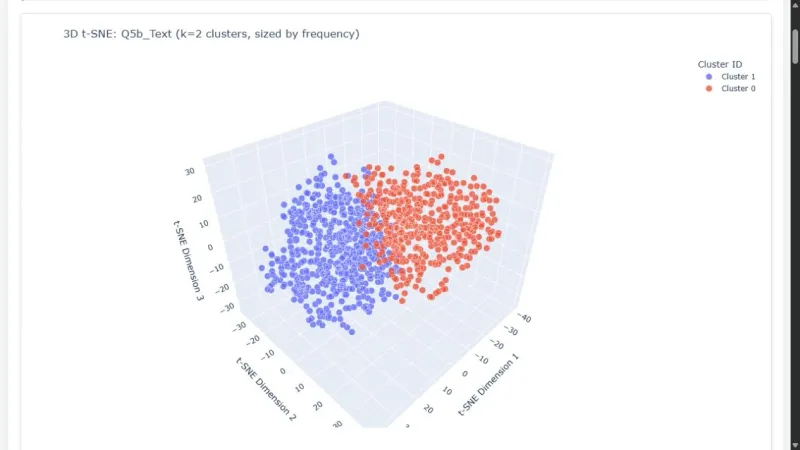
Round 2 asked participants to turn a survey about Canada’s present and future into an engaging data story. I explored the relationships between open-ended answers in a space users could rotate, zoom, and inspect.
Process
I generated OpenAI text embeddings, reduced them to three dimensions with t-SNE, and selected K-Means cluster counts using silhouette scores. Identical responses were aggregated; cube-root marker sizing made marker volume reflect frequency. Plotly supplies interactive maps and hover text.
Reflection
This extended my earlier student-survey maps. Iterating on clustering, sizing, and presentation made the responses easier to explore, while the geometry remains an exploratory representation of the data.
Gallery