Links
Overview
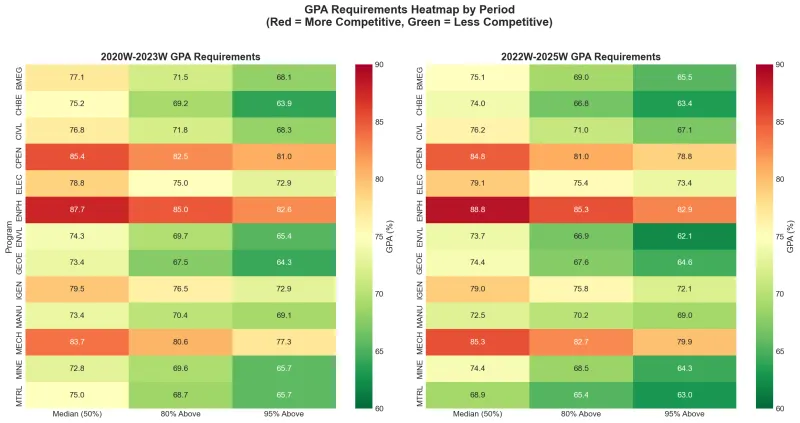
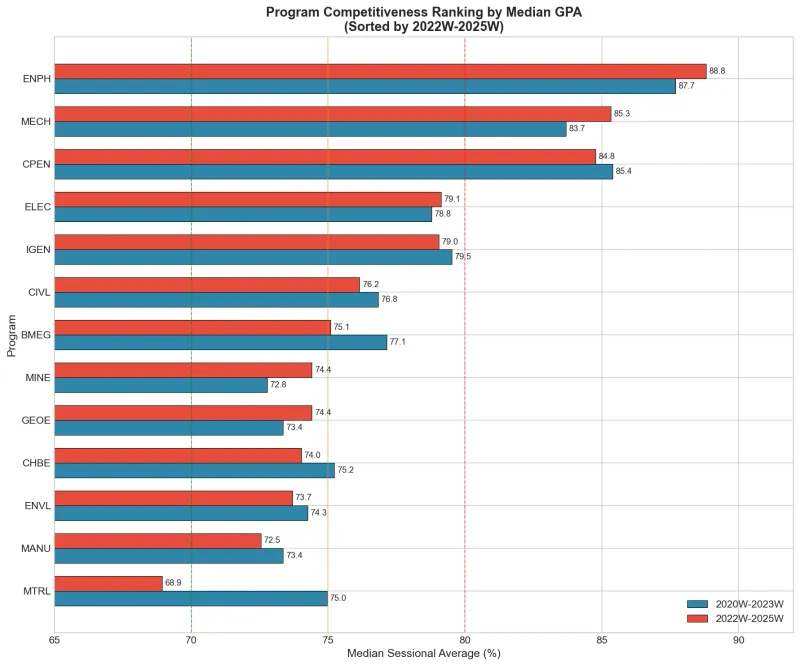
I compared placement statistics from the 2020W–2023W and 2022W–2025W reporting periods to explore differences between engineering programs. The charts express historical placement averages as percentages.
Process
OpenCV detects colored annotations on the official charts, then calibrated pixel coordinates are converted to GPA values. A Jupyter analysis produces rankings, heatmaps, and estimated distributions, with a LaTeX report.
Result
Produced the analysis and report. Values extracted from charts and fitted distributions are estimates; historical placement statistics do not predict admission thresholds.
Gallery